Recipe #5: Automation for Web Performance - All Flavours Lighthouse

A Glimpse Into Web Performance
During the last four to five years, web performance has grown to be a huge topic of discussion and innovation across the internet-connected industry. It would be really convenient for anyone to be able to define briefly the components that gather under the umbrella of this term, but that is not the case.
At a really high level we can list a few that are already specific towards the web:
Just the three items that popped up pretty easily in my head, are topics that deserve tomes and tomes of information, details and technotropies. The good thing though is that we do not need to digest all the information to be able to improve them on the context of our own projects.
Lighthouse
Just a pinch of understanding would be enough, and here is where Lighthouse comes in the picture.

Lighthouse is tool that helps technologists audit, monitor and improve the overall quality of web pages, open-sourced under the Google Chrome umbrella. If you do not know it yet, it is already included in your Chrome and Edge browsers. Some details on how to run it if you haven't yet. Lighthouse tab in Chrome, Lighthouse tab in Edge.
"Overall" can sound cheeky and soft-handed to people that are software specialists. To their surprise Lighthouse is, at least in my opinion, one of the projects that has, is and will be improving the quality of the web as we experience it in many aspects. By default it includes suggestions for:
Great engineering effort from many slices of people across the tech community, has made this tool a powerhouse and indisputably the "go-to" for performance monitoring.
If I were you, I would explore the categories and capabilities right away, the ROI is huge!
After you have gotten over the stroke that you got from the awesomeness of the tool, let me make you tremble once again by telling you that the whole report that Lighthouse has generated, together with granular performance metrics and more data, can be retrieved in an automated way using a single command or in more complicated scenarios just a few lines of JavaScript code.
In action now!
Lighthouse One-Line
If the specific page or set of pages that you wish to run Lighthouse against, are valid for all the criteria below:
Then you can just use the lighthouse-cli or go with Google Pagespeed Insights (that uses Lighthouse internally) and you do not need anything additional.
You can follow along with a simple setup, that will provide a separate place to run and store your Lighthouse reports from using the command line interface, starting with a bare Node.js project.
In your command line, let's build a new project for our task at hand:
mkdir auto-lighthouse
cd auto-lighthouse
npm init -y
Having scaffolded a project, installing the required library comes next:
npm install lighthouseOnly with the Lighthouse npm module installed, you can now run:
npx lighthouse https://dev.toWhat happens now is that you will see a Google Chrome instance launching in your machine, automatically navigating to the supplied URL, doing some magics and finally producing a single file inside the project folder. The file generated is an HTML file with a name structured like: {SUPPLIED_URL}{DATE}
Go and open this file in your browser of choice. There you have your amazing report to distribute in your team to reveal their incompetencies. 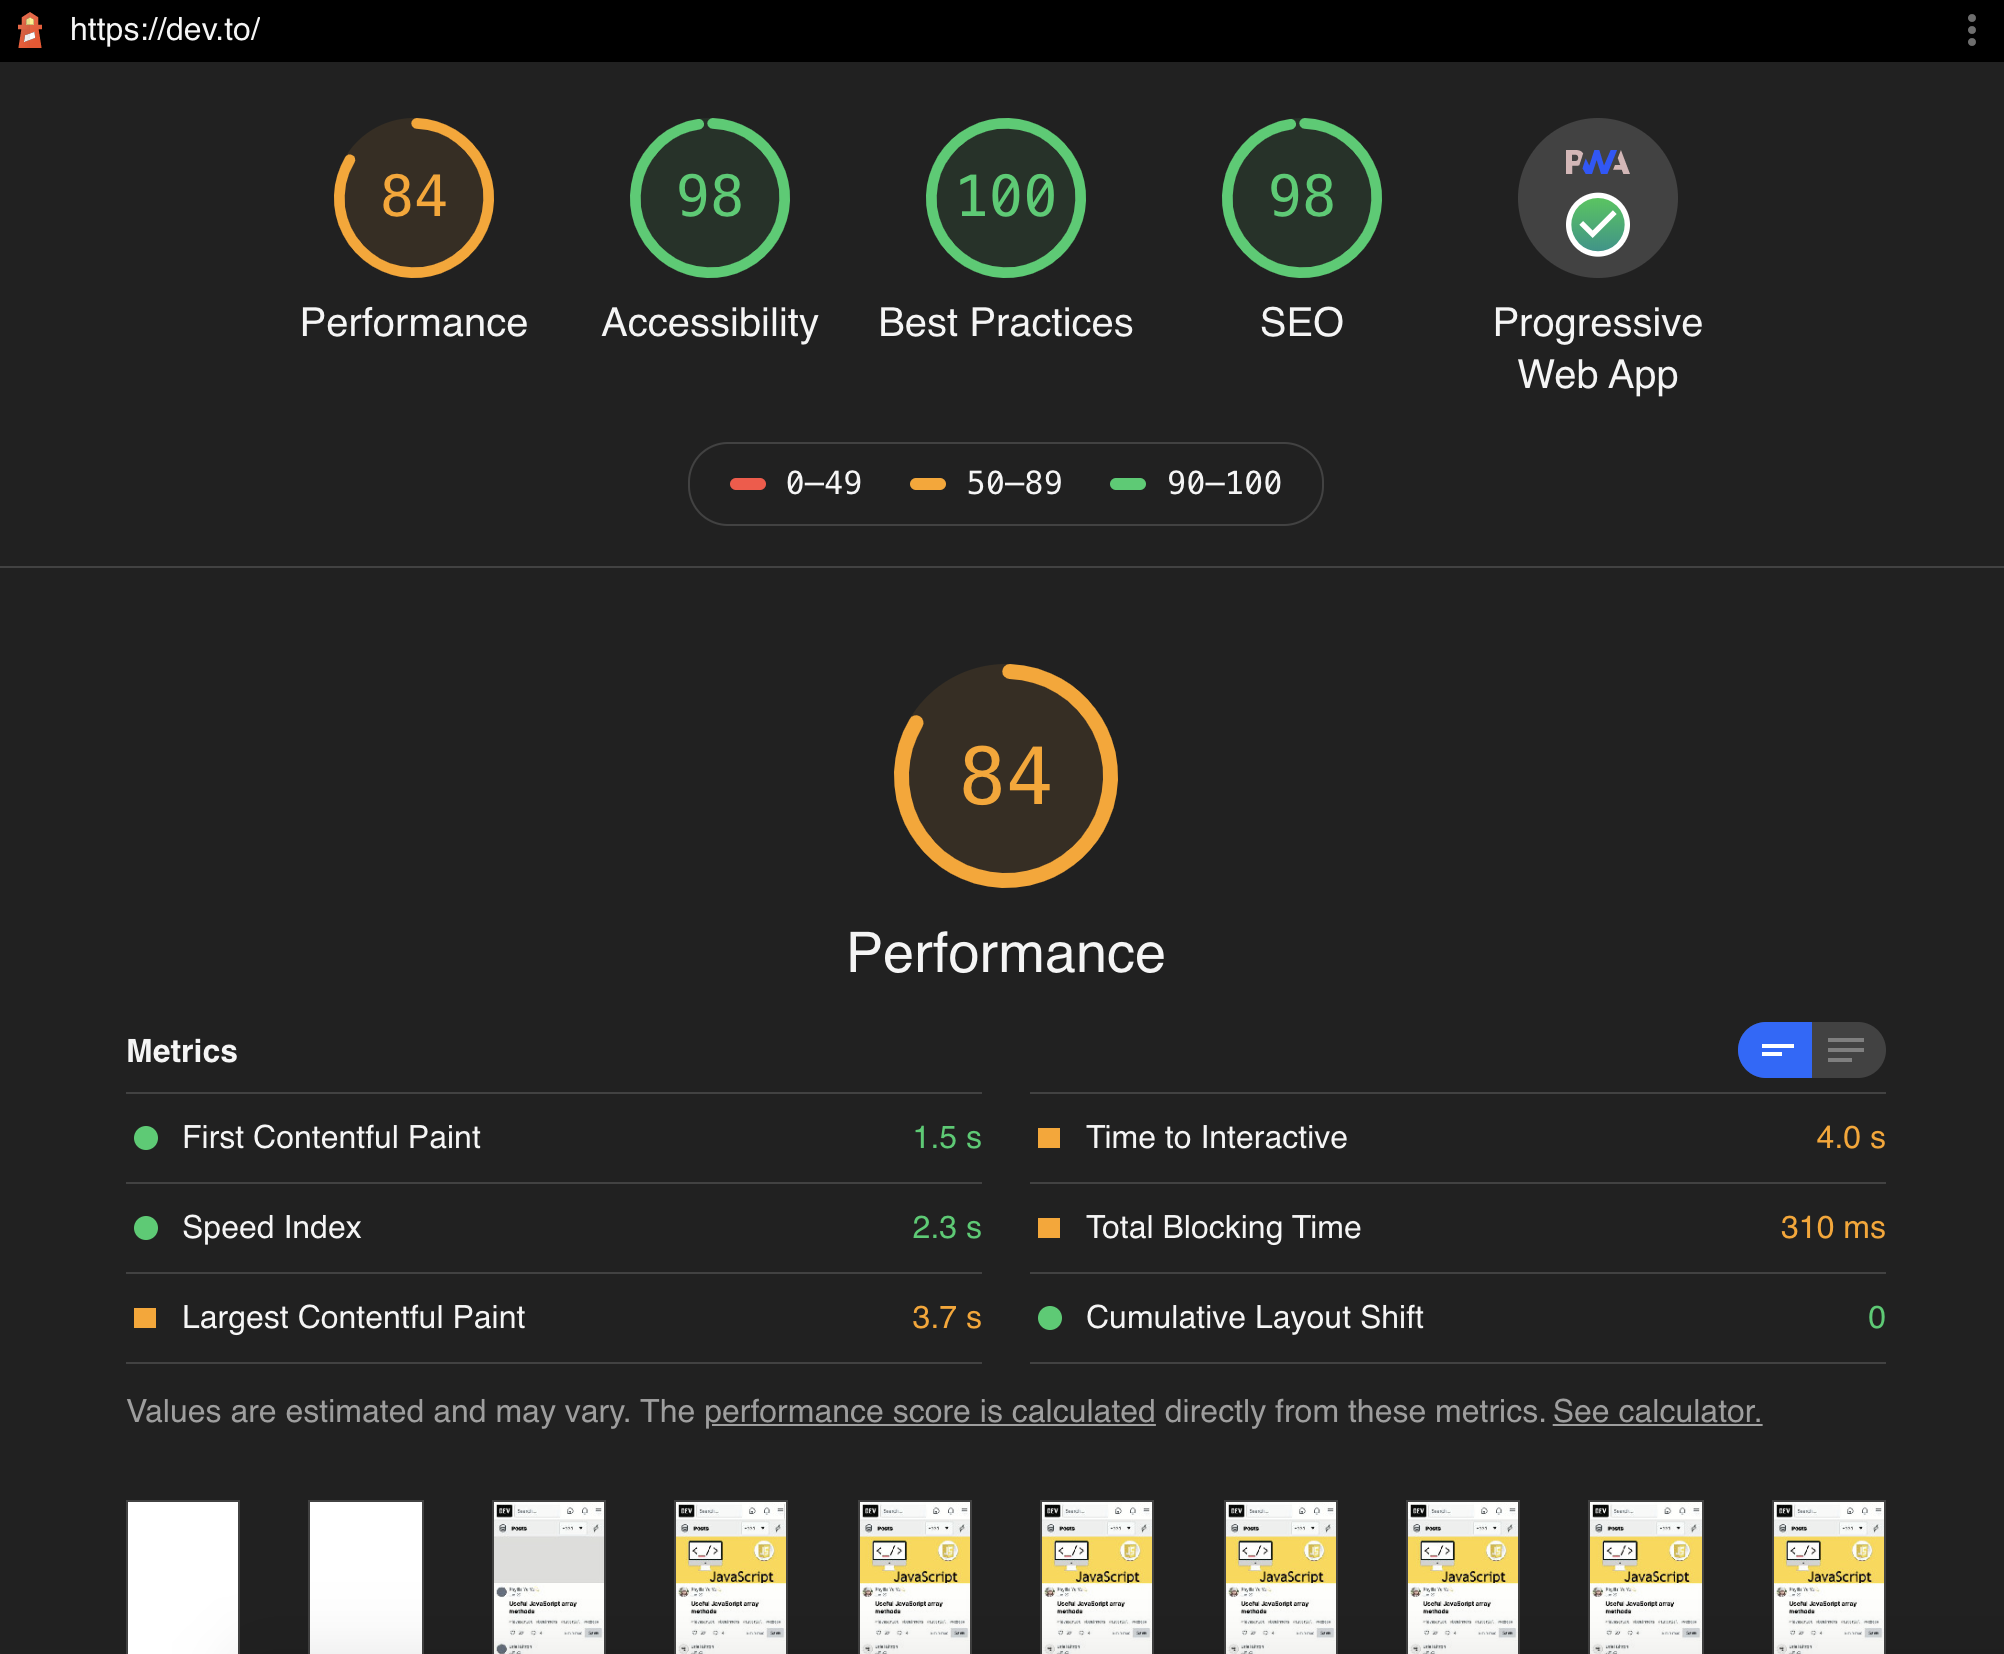 Special Hint: If you want to save the file but also open the report automatically in your browser you can run the cli command with the --view option.
** If you wondering why your report is showing the device field as "Emulated Moto G4", you are not the only one confused. Monitor the rabbit holes here.
One Step Further Tailored for You
Since you made it to this step you are either interested in the shiny content we have or the situation you want to automate your Lighthouse reporting is a bit more intricate for example...
Hmm...
We cannot pre-bake state in the browser using the lighthouse cli...
We cannot authenticate the user safely without going through a login action at least...
How would we go about those scenarios then ?
Of course we can use our favorite Node.js browser automation libraries, Puppeteer or Playwright. Using these libraries, we would be able to orchestrate the steps needed to arrive at the correct application state, and then run Lighthouse.
Now The Code
*I am sure you are eager to jump into the code and this is what we are gonna do. But as we progress through it, I will try my best to explain what seemed unclear (at least to me) when trying to get this process down.
First up, you should go ahead and install the additional npm package we are gonna need to make this work. For demonstration purposes we will install Puppeteer.
npm install puppeteerNext create a new file called index.js with the following context:
const puppeteer = require("puppeteer");
const lighthouse = require("lighthouse");

(async function(){
  const url = "https://dev.to"; /* Random */
  const PORT = 9222; /* Not arbitrary, the default Lighthouse would look for if not specified in options */

  const browser = await puppeteer.launch({
    args: [`--remote-debugging-port=${PORT}`], /* Expose this so we can use it below */
  });

  const lighthouseOpts = {
    port: PORT,
    disableStorageReset: true /* For the custom steps we will show later */
    logLevel: 'info', /* To observe the good stuff */
  };

  /* Run Lighthouse, using the options specified */
  const lighthouseResult = await lighthouse(url, lighthouseOpts);
  console.log(lighthouseResult.lhr) /* Inspect the "lhr" (lighthouse report) property in the console */

  /* Kill the browser 🔪 */
  await browser.close()
})();
Probably the first question that comes into your mind is: Why are we using this remote-debugging-port thing ?
One of Lighthouse programmatic capabilities is that it can connect to an existing browser instance by using the provided port the browser is using.
If you run the script now, it will have the exact same behavior with the CLI version but it will not result in a new HTML report in your directory, instead it will just log the lhr property on the console.
Adding The Custom Steps
As you might have suspected already, there is a place in which your additional logic can go in, in order to drive the app to the state you require.
const browser = await puppeteer.launch({/*...*/});

/*
 * Additional Web Automation logic
 * await authenticate(browser, ...args);
 * await fillEphemeralStorage(browser, ...args);
 * ...
 */

const lighthouseOpts = { /*...*/ };
An example of a function that you would use:
async function authenticate(browser, signinUrl){
  const page = await browser.newPage();
  await page.goto(signinUrl);

  const emailInput = await page.$("input[type=email]");
  await emailInput.type("admin@admin.com");
  await page.click("button[id=go]");
  await page.waitForNavigation();

  await page.close();
}
Functions like these will result in a state specific to your application needs but remember that it will probably have to do with something along the lines of:
After the setup functions are completed, Lighthouse can be called to run at the target URL.
The Important Lighthouse Parameter
Because of the Lighthouse inner workings, the metrics to be collected and heuristics of the collection, every time an audit is requested, a new page will open but with the browser storage cleaned up, unless stated otherwise. That is understandable in order to start from a clean" slate. You can see the code for this process here.
To make sure our setup is not reset by Lighthouse, we pass the parameter disableStorageReset set to true. Now our setup is safe!
Handling The Report
Currently the only processing we are doing in the report is logging it out in the console. Not so handy!
To our benefit, the Lighthouse API exposes a method in which we can generate a full report by providing the collected data and the format we want to report to be produced in.
/* ... */
const { generateReport } = require("lighthouse/lighthouse-core/report/report-generator");
const fs = require("fs");
/* ... */
const { lhr } = await lighthouse(url, lighthouseOpts);
fs.writeFileSync("./report.json", generateReport(lhr, "json") );
What we have done here is demonstrate how we can use the generateReport function to create a new report in JSON format and put it in a new file called report.json in the current directory.
*The generateReport function can be used to output JSON, CSV and HTML formats for now.
If you go and open this file, you can see the whole slew of web quality metrics. There is a really high chance that you were not aware how many things are collected and reported by Lighthouse.
Schedule the script to run for all the websites you manage and you are good to go!
Closing
Thank you for going through yet another recipe. I hope that you have a bit more ammo to convince you project leads that an automated Lighthouse audit can give you many bangs over zero buck. My suggestion is to take a day off from work and just see and study all the metrics reported.
Time well spent!
Spread the report and specialized insights inside your team/organization in order to drive change for the better that will benefit the end user. In the near future we will see some more stuff around web automation and performance monitoring. See you then!